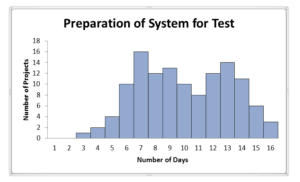
Use of Total Quality Management tools – Histogram
We would like to revisit our blog post May 2013 and tell the complete story over the course of a few blogs. I realized the importance of showing the use of the variety of tools after giving an ITMPI webinar based upon our book Total Quality Management for Project Management. At the end of the demonstration of the variety of techniques, I was asked how to apply them. I realized then, that I had failed. So to try to improve that failure, I will use the next few blogs to demonstrate how the TQM tools can be used explore and address a specific problem.
The area we chose to explore was around our verification activities. This company is a vehicle design and manufacturer. The vehicle system integration and verification activities take longer than they would like. Anecdotal evidence suggests preparation time to be considerable. The management digs through the historical record, new projects the metric of vehicle preparation time is identified and added to the verification group’s list of metrics.
Now let us discuss the histogram is some detail. The histogram is a graphical representation of a data distribution. We breakdown the range of the distribution into discrete non-overlapping segments (bins) to which we will tabulate the number of incidents falling within that range or bin. The first things we need to calculate – the number of bins needed. We can start by counting the number of data points we have and take the square root of that number and round up to a whole number. That is a good estimate for the Number_of_Bins that will be required.
Next, we want to know the range for the bins to cover. To calculate the range:
Range_of_Value = Maximum Value – Minimum Value
Now we need to know the width of each of these bins. The width for each bin, is calculated by dividing the Range_of_Value by the Number_of_Bins. Now we have discrete segments that will ultimately total our range of possibilities. We then populate each bin with the number of occurrences for that bin, ultimately giving us a visual representation of the distribution.
We learn a little from this exercise. We know that we should not expect testing to start on day one or day two of the vehicle availability. In fact, we must consider that we may not be able to start the testing for up to 16 days after the arrival of the test vehicle. Anything shorter than the longest time shown in the graphic above (16 days) may mean our test schedule is impacted.

