

In our previous post, we have learned the distribution of vehicle preparation time via the visual representation known as the histogram. This does not tell us what causes for the distribution. If we wish to alter this distribution, we will also need to know the causes and take some action to alter. Enter the Ishikawa diagram, also known the fishbone diagram, or cause and effect diagram.
The Ishikawa diagram is a tool that facilitates a collection of potential causes for the variation we are seeing. Brainstorming on its own can be a bit chaotic. We may have ideas flying in from all participants with little rhyme or reasons, and occasionally the ideas connecting.
Ishikawa Template
We will brainstorm to generate the causes of the effect that we are witnessing. In this case we want to answer the question:
Why does vehicle preparation time take so long?
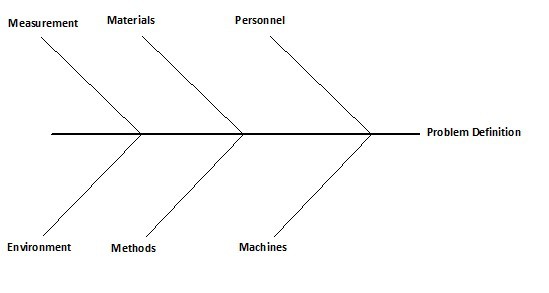
Our first step is to identify those variables that influence our vehicle preparation time. Below we show an example of the Ishikawa diagram with the typical headings on “the bones” immediately radiating off of the core or “spine bone”. At the end of this bone, we have the problem we are exploring.
The structure on the lesser bones off of the core, are typically associated with areas where things can go wrong. These are to guide our discourse, and can look like the list below.
- Measurements
- Materials
- Personnel
- Environment
- Methods
- Machines
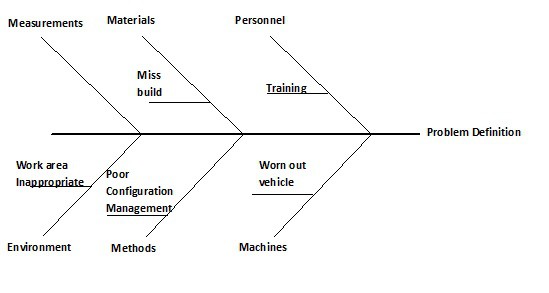
We will then put ideas associated with each of the top level categories. We begin to populate the fish bones with things that can go wrong that we believe could deliver the symptoms we are seeing. We will add more bones under the secondary bones to further articulate the area of concern. For example, under “Environment” we have “work area inappropriate” under that we can have items such as “no electricity”, “exposed to the elements” or other attribute we believe can contribute to this problem definition.
We will then put ideas associated with each of the top level categories. We begin to populate the fish bones with things that can go wrong that we believe could deliver the symptoms we are seeing.
We will continue with the construction of the diagram with ideas that out team believes can contribute to the problem definition. We will then need to find ways to prove or disprove some of these suppositions to narrow in on the cause(s) for the problem definition.