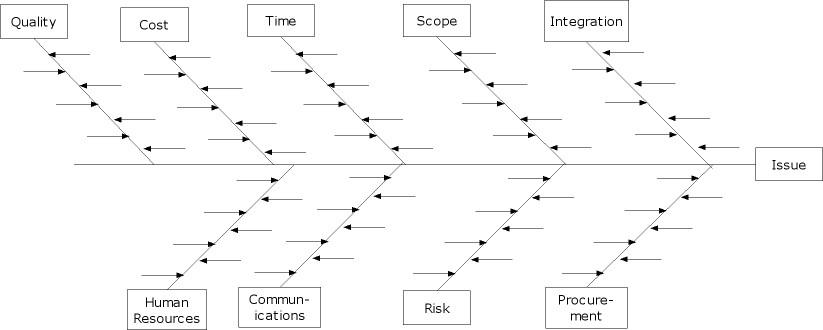
Ishikawa (fishbone) diagrams and Risk Management
Several quality tools can help to evoke the risks that may be associated with your project. One such tool usually associated with cause and effect is the Ishikawa diagram. We can use this tool to explore risks as well. We will explore what happens (cause) and how it will impact (affect) our project and product. In this regard, this tool works also as a proactive exploration rather than the typical use of tracing problems that are already visible.
The problem can be expressed thusly: inability to achieve schedule target. We then break that down into those things that would make achieving the schedule improbable. For example, people, processes, etc., and for each of those, we can break them down even further. For our people subset, we may have insufficient people, the wrong skill set, inadequate training, poor planning and so on. Once we have identified areas of risk, we want to put some numbers to the result so that we can prioritize our counteractions.
We use the Ishikawa tool to help direct our anticipatory considerations when reducing risk. We can use the tool directly or take what we have developed and formalize it by putting the contents into a failure mode and effects analysis (FMEA). The FMEA can be used to reduce our risk and provide a handy tool for tracking anticipatory actions.
Readers of this blog will notice how similar this approach is to brainstorming. We can also connect with our configuration management activities and tools because uncontrolled change is generally a high risk source. Some simple steps for doing what we are suggesting might look like:
- Determine the major issue
- Brainstorm related items using Ishikawa diagram
- Transfer items to FMEA or similar format
- Perform counteractions and update FMEA
- Keep FMEA itself (and the Ishikawa diagram) under configuration management
- Monitor results.
More can be found on the Ishikawa diagrams at our download area at https://valuetransform.com/downloads.

