

Agile in Conventional Project Line Management
The following is a story from a couple of years back. The story is about lengthy set of verification activities (multiple iterations) in a large conventionally run project. As many a test engineer will relate, testing is always cramped for time. Meaning, the time we want the answers is much less than the time required getting those answers. This project was not different. I have experience in agile and have used these tools in other project capacities. However, this was a large project of which I was responsible for the verification group’s activities. I am a line manager (in this instance the agile role more like a scrum master) in a matrix organization so the verification team members of the project report to me as well as the project manager.
Scope of Work
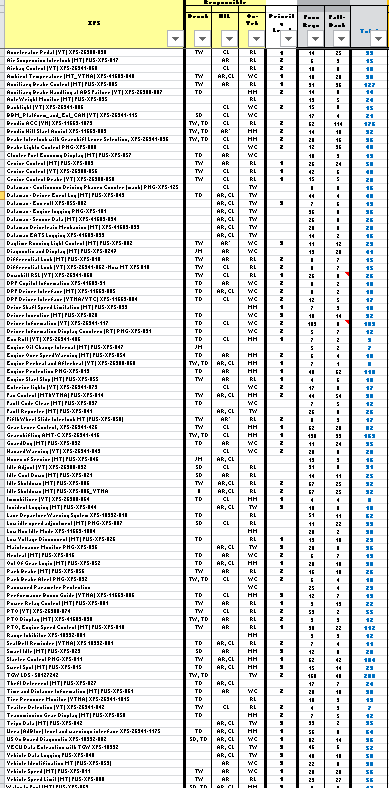
The first step is to identify the scope of the work. We found all of the implicated specifications and identified all requirements within those specifications that are impacted. The team collaboratively identifies and assigns test cases (self directed work team another agile aspect). This sheet (columns omitted due to size) also has a column for the individual’s to report the progress (number of test cases completed per specification). This team progress reporting will be compiled and compared to a target daily. We will end up using that later in the project and in subsequent blog. The items are prioritized by how critical. High priority are vehicle safety systems, and operational systems (vehicle must have to legally be on the road) next convenience features. Analogous to the prioritized sprint backlog.
Progress Tracking Resembles Agile
I recognize the company’s need to have the verification progress as quickly as possible while conveying the progress to the next level of management. To make this a simple view I chose to use a agile-like mechanism (analogous to the burn down chart). In this case, it is percent completion of the total test cases to the total to be performed. I had started out with actual test case number on the left vertical axis. This line was generated by an “estimate” of the number of test cases per day per individual testing.
This provides a nice map of the expected or planned rate of accomplishment over a period of time. The number of test cases to be executed is a few thousand, hence the number of days to conclude.
You can see this fills a similar role to a burn down chart when it comes to progress tracking. The chart is the estimated amount of time (subtracting weekends) to perform the work, over the work week of the number of people available. In this case, the entire scope of the work needed to be accomplished in one setting so it was not possible to use 2-4 weeks. So we have a plan based upon the scope of the work (number of test cases), that is also connected to the available talent and their hours. Very similar to an agile project burn down chart except instead of a decreasing of the available hours, it is the sum of the hours taken against the expected hours to complete.