
Deterministic vs Probabilistic: What They Mean for Quality and Manufacturing
Deterministic vs Probabilistic: Definitions that Matter in Engineering
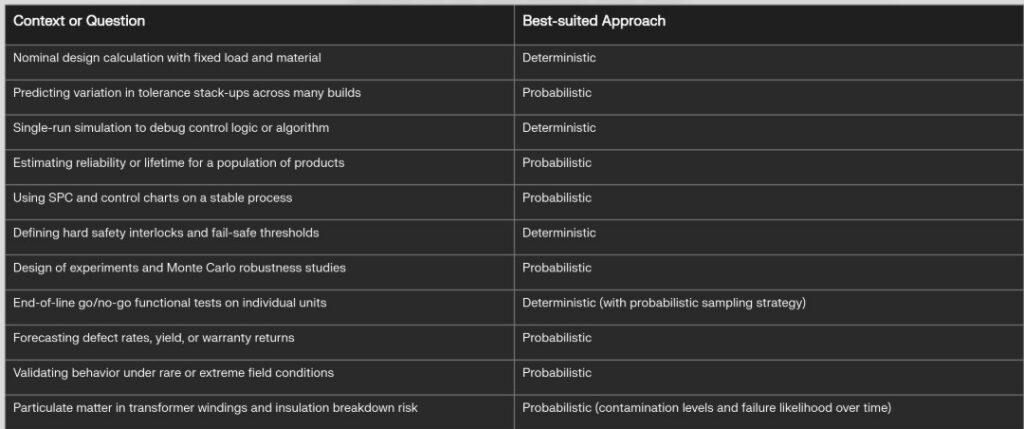
In engineering, deterministic vs. probabilistic refers to how we model cause-and-effect relationships and uncertainty. The difference between the two requires concepts that are important and should drive how we behave. A deterministic view assumes that the same inputs will always produce the same output; given the system and its conditions, behavior is fully predictable and repeatable.
A probabilistic view assumes that, even with the same nominal inputs, outcomes vary, and we should think in terms of likelihoods, distributions, and risk rather than point predictions. For real products and manufacturing lines, both perspectives matter: we design as if the system should behave deterministically, but we analyze and control it using probabilistic methods.
Impact on Product Development and Design Decisions
During product development, deterministic vs. probabilistic thinking manifests in how we write requirements and build models. Deterministic design assumes fixed loads, exact dimensions, and ideal conditions, leading to a single safety factor and a single “answer” for strength, performance, or life.
Probabilistic design recognizes that loads, material properties, usage, and environments vary, so we specify distributions and design for an acceptable failure probability rather than zero risk. This shift affects: tolerance stack-ups, fatigue life estimates, thermal behavior, EMC margins, and reliability allocations across subsystems.
Teams that rely solely on deterministic assumptions tend to underappreciate tail risks and field variation, and they often discover problems late in validation or in service.
Teams that incorporate probabilistic thinking earlier can size margins, safety factors, and design of experiments (DoE) to address real variability rather than nominal conditions.
 Verification, Validation, and Test Strategy
In testing, deterministic vs probabilistic thinking influences what “passed” really means. A deterministic mindset treats a test as a yes/no gate: if it passes once (or a few times), the function is declared good.
A probabilistic mindset asks how often it passes, under what spread of conditions, and with what confidence.
This leads to:
-
Sample size calculations instead of the arbitrary “test three parts.”
-
Designed experiments to see interactions between factors.
-
Reliability tests framed in terms of failure distributions, not single lifetimes.
In systems development, deterministic models (e.g., simulations and digital twins with fixed inputs) are essential for validating logic and nominal performance. Probabilistic extensions (randomized inputs, noise, parameter variation) then explore robustness and expose edge cases that deterministic checks alone will miss.
 Deterministic vs Probabilistic in Manufacturing and SPC
Manufacturing lines are a practical laboratory for deterministic vs probabilistic behavior. We design processes as if each cycle produces exactly the same part, but in reality, outputs vary due to machine, material, environmental, and human factors.
Statistical process control (SPC) and control charts sit right at this interface:
-
Deterministic assumption: the underlying process has a stable cause system, so within-control-limit variation is inherent and predictable.
-
Probabilistic reality: each measurement is a random draw from a distribution; control limits are probability thresholds for detecting special causes.
This leads to important limits:
-
If the underlying distribution is not approximately stable and normal (or at least well understood), classical control chart rules can mislead.
-
Non‑stationary processes (tool wear, mix changes, seasonal effects) violate the assumption of constant mean and variance, inflating false alarms or hiding real shifts.
-
Measurement system variation (gage R&R) adds another probabilistic layer; poor gages distort estimates of capability and stability.
So while control charts look deterministic on the wall (lines, limits, rules), their power and their limits are entirely probabilistic. Misunderstanding this can lead to overconfidence in charts for processes with strong non-normality, heavy tails, or drifting parameters.
A Quick Story
Consider the company that builds a product on a manufacturing line. Product quality depends on assembly cleanliness, but not to the extent that a cleanroom is required. In discussing reliability, it is important to distinguish between deterministic and probabilistic behavior. A deterministic view assumes that if a design parameter exceeds a fixed threshold, a failure will occur in a predictable, repeatable manner. In contrast, a probabilistic view recognizes that real systems exhibit variability—manufacturing tolerances, material imperfections, and contamination—so failures occur with probability rather than certainty. The volume of particulate matter, its proximity to other particulates, and its proximity to the product’s features all contribute to whether a failure mode occurs.
Quality of Output and the “Price” of Variation
From a quality perspective, deterministic vs probabilistic thinking changes how we talk about “good” output. Deterministically, if the process is “in control,” we might expect all parts to be good; practically, we know there is always a finite probability of defects. As variation increases (wider distribution, more noise, more drift), the probability of crossing specification limits rises—even if the process center stays the same.
This means:
-
A process can be “statistically in control” yet still produce an unacceptable fraction of nonconforming parts if the natural spread is too large relative to specs.
-
Capability indices like Cp and Cpk are probabilistic summaries: they implicitly assume a distribution shape and translate spread into expected defect rates.
In other words, increasing variation increases the probability of being in the tails: more scrap, more rework, and more escapes to the customer. Even when components remain within specification, higher variability often erodes system robustness (stack-ups, noise sensitivity, performance scatter), manifesting as customer dissatisfaction rather than obvious rejects.
Increasing Probability with Increasing Variation: What That Really Means
“Increasing probability with increasing variation” sounds positive, but in manufacturing and quality, it usually means increasing probability of undesired events as variation grows. The distribution widens; more mass falls outside the specification limits, and rare events become more common.
Practically:
-
For a narrow, well‑centered process, the probability of out‑of‑spec parts is very low; control charts show small, predictable noise.
-
As variation increases (tool wear, unstandardized work, mixed materials, poor maintenance), even the same mean process yields more points near the limits and more specification violations.
-
Control charts still function, but the system is now signaling more frequently—not because the chart is “too sensitive,” but because the process is genuinely more risky.
This is where deterministic vs probabilistic thinking clarifies decisions. Deterministically, you might widen limits or relax specs to make the chart “quiet.” Probabilistically, you recognize that customer risk is increasing and that you must reduce variation, not simply redraw the lines.
 Using Both Mindsets to Improve Product and Process
In practice, the best engineering and manufacturing organizations do not choose between deterministic vs probabilistic thinking—they integrate them.
They:
-
Use deterministic models and requirements to define clear targets, interfaces, and functions.
-
Use probabilistic methods to quantify variability, risk, and confidence in meeting those targets under real-world conditions.
For product development, this means robust design and reliability engineering that treats variation as a design input, not a surprise. For testing, this means structuring verification and validation around coverage, sample size, and distributions rather than isolated pass/fail events.
For manufacturing, it means running SPC with a clear understanding of its assumptions, using capability indices and distributions to drive continuous reduction of variation. That combined mindset turns quality from a static compliance exercise into an ongoing, data‑driven process for managing risk and performance.

For more information, contact us:
The Value Transformation LLC store.
Follow us on social media at:
Amazon Author Central https://www.amazon.com/-/e/B002A56N5E
Follow us on LinkedIn: https://www.linkedin.com/in/jonmquigley/
https://www.linkedin.com/company/value-transformation-llc
Follow us on Google Scholar: https://scholar.google.com/citations?user=dAApL1kAAAAJ